
Cartographic Visualization, New Visualization Methods
Aperigae provides products and services in new visualization environments and tools for geospatial (2D - 3D) data.

Aperigae provides products and services in new visualization environments and tools for geospatial (2D - 3D) data. As the requirements of user community changes with the enabling technology, formats and standards for 3D visualization, Aperigae’s capabilities are combined with the new visualization opportun,ties and media to visualize a phenomena related to a 3D model (LOD0, LOD1, LOD2, LOD2). Aperigae’s aim for visualization is combining accuracy with beuty (esthetics) to convey the information correctly to the reader(user). Aperigae match the basics of spatial datavisualization theory, application and past experience with the opportunities of new technology to satisfy the rule of tumb of cartography such that the purpose of visualization is transferring message to the receiver related to a spatial phenomena or spatially referenced information. Aperigae’s service and products are both creative and innovative for the particular purpose and use, in the mean time convey expected message in the frame of user experience and environment. The new visualization platforms provided by the game technology attracts all for its capabilities. On the other hand, if a thematic data, statistical data or any phenomena is visualized on a 3D model (any Level of Detail x), in addition to very extensive opportunities of visualization, it also host misinterpretation in case of created by irrelevant non-graphic currators, artists or cartographers. Aperigae is able to provide new visualization opportunities to the customers, provided that the challenges and problem fields are handled by measn of practical, Professional and scientific backgroun on vartography and spatial data visualization.
Aperigae provides service, and consultancy for visualization of geospatial data, georeferenced phenomena, statistical data as well as graphical and cartographic design, color management and so on.
- cartographic visualization
- map production systems
- color management and color calibration
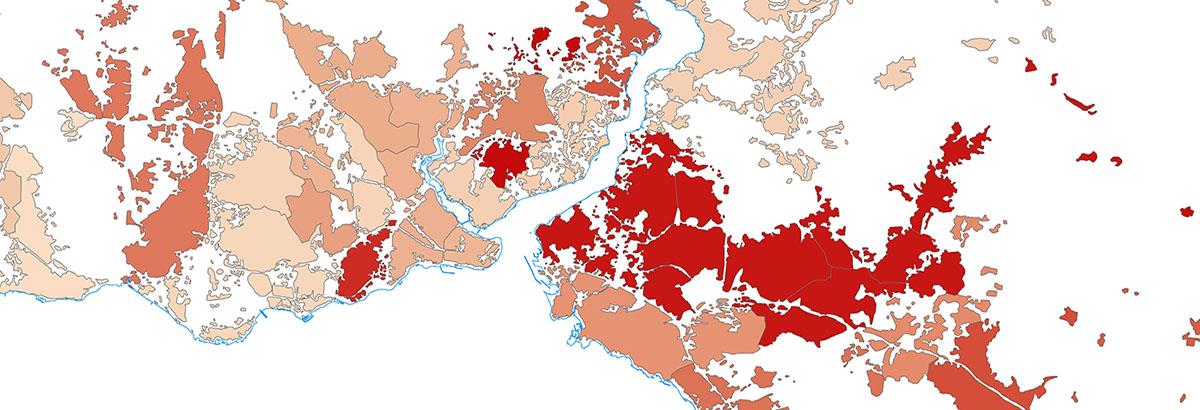
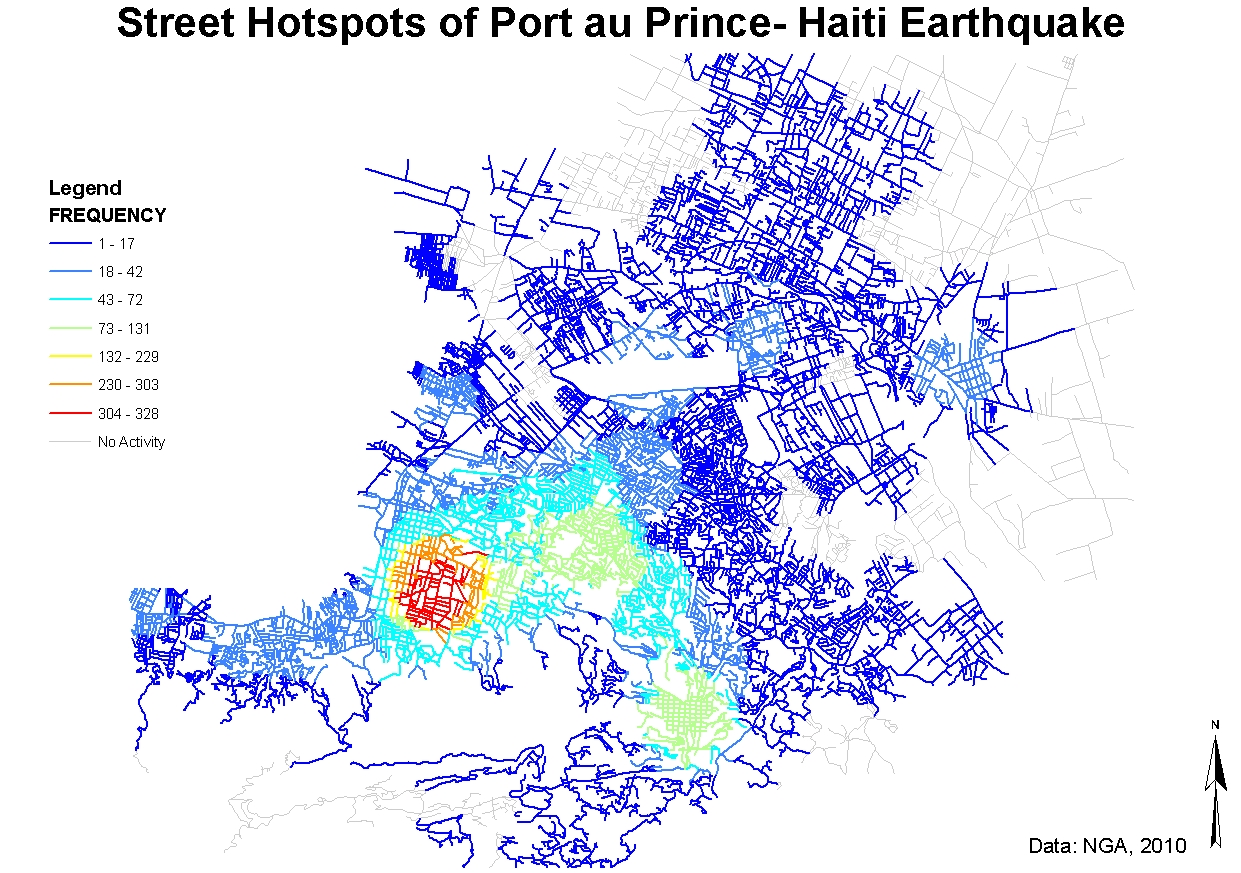
- thematic maps: Eg. Census, agriculture, physiographic, elevation, ethnicity, language …
- thematic maps: national, regional, global
- visualizing statistical data
- web mapping, web map servicing, story mapping, mapping on the cloud
- 3D visualization
- geo-visualization and geo-visual analytics of statistical data and outcomes of spatial data mining
Aperigae’s service on cartographic visualization comprises the image maps which contains necessary marginalia, supplementary geo-data and geonames.
© Copyright 2025 Aperigae.com